
How to Forecast Your eCommerce Using Data
 By Juan Cruz Giusto ·
“No wind is favorable for the one who doesn’t know where they’re going” — Seneca
Forecasting is an essential tool in eCommerce.
The problem is that most brands do it without solid foundations, treating it like a guessing game or a reflection of what they’d like to happen.
Instead of basing it on the past and on strategy.
For example, we can’t expect to grow 30% by doing the same thing as last year; something has to change.
That’s why, more often than not, the forecast ends up as a forgotten document in a Drive folder that gets looked at once a month.
But at the best eCommerce brands, the story is different.
How the Best Use the Forecast
They use it as a north star that sets the goals and a yardstick to measure results.
That way, the forecast stops being a guessing game and becomes an exercise in execution that helps you:
- Set realistic goals based on historical data
- Make them ambitious at the same time, to push the team to give it everything
- Build strategies that can justify the growth
- Work every single day so those goals are hit and the strategy is followed
- Spot quickly when you’re drifting off course
- Take action to correct course and hit your targets.
And even though it looks like a theoretical exercise, it ends up being essential for scaling your eCommerce profitably.
But before we dive into how to forecast your business, let’s look at the parts it’s made of.
The Tree Model: Understanding Your eCommerce
To forecast your business properly, you first need to understand the parts that make it up.
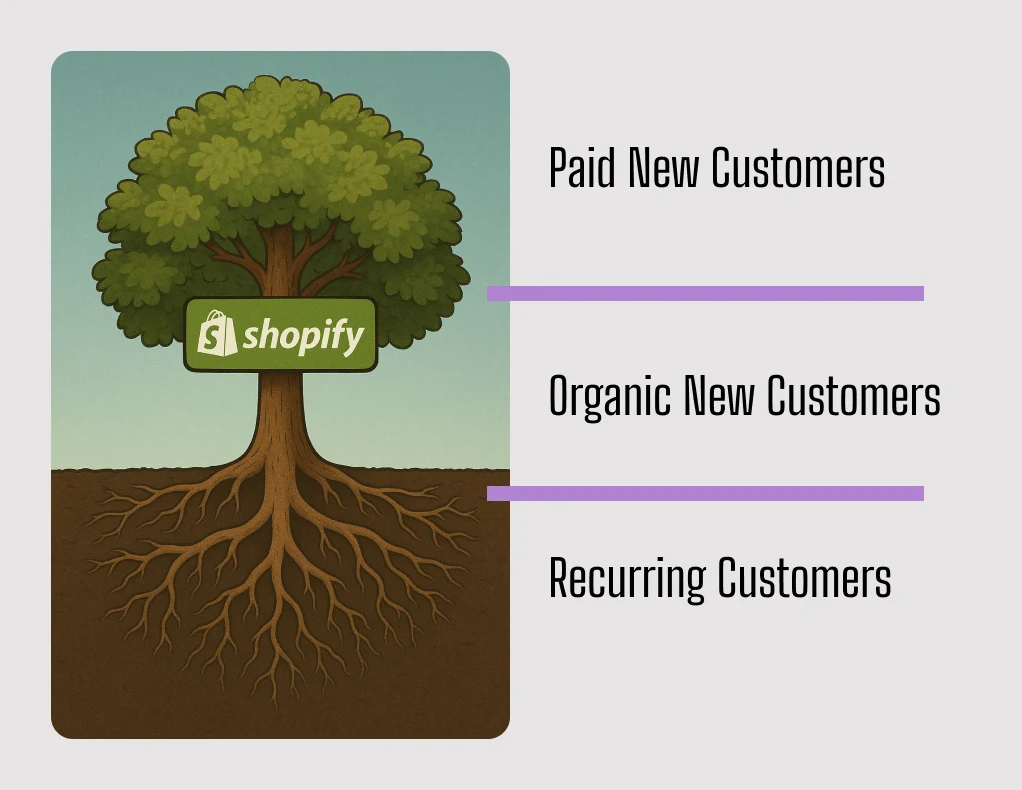
And the best analogy I’ve found is a tree, with three fundamental parts:
The Roots: Recurring Customers
They’re the most profitable of all, since you don’t have to acquire them again. They’re also the easiest to predict because they tend to behave in similar ways.
The Trunk: Organic New Customers
These are people who already know your brand but haven’t bought yet. They follow you on social, you have their email/SMS, or they’ve interacted with your posts. In other words, they’re the people who’ll buy from you without having seen any paid ads.
Put another way, if you stopped spending on marketing, these are the people who’d buy from you anyway.
The Branches: Paid New Customers
These are the people who don’t know you and you have to go out and convince. They’re the most expensive to acquire and the hardest to predict, since you depend on external platforms to reach them.
If you turn off your ads, these people would never buy from you.
Why Does This Analogy Matter?
Besides helping you understand the parts of your business, it also helps make sense of more complex dynamics.
Just like a tree with shallow roots and a thin trunk falls over in the first strong wind, an eCommerce that relies mainly on paid ads to grow puts the business at risk with any change:
- Tariffs (like what happened in the US with Trump and China)
- Algorithm changes and restrictions like GDPR and iOS
- New competitors selling at prices way below yours
It’s normal for the vast majority of sales to come from customers acquired through ads in the beginning.
But as your eCommerce matures, it’s crucial to increase the share of recurring customers and build a brand so you can drive sales without relying solely on paid ads.
Now, let’s look at how to forecast each part…
How to Forecast Each Part
The Roots: Recurring Customers
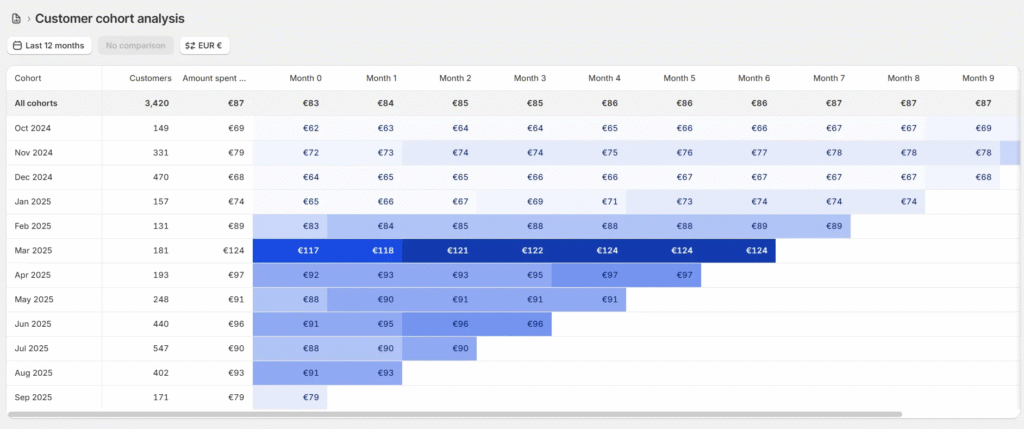
They’re the easiest to predict because they tend to behave in similar ways.
You can check this in Shopify, in the cohort analysis. No matter which month they come in, you’ll see the LTV growth is very similar, which confirms their buying behavior is consistent.
That said, keep in mind this behavior can change if:
- You add new products to your catalog
- You improve your SMS/email campaigns
- You introduce subscriptions or memberships
How to Calculate It:
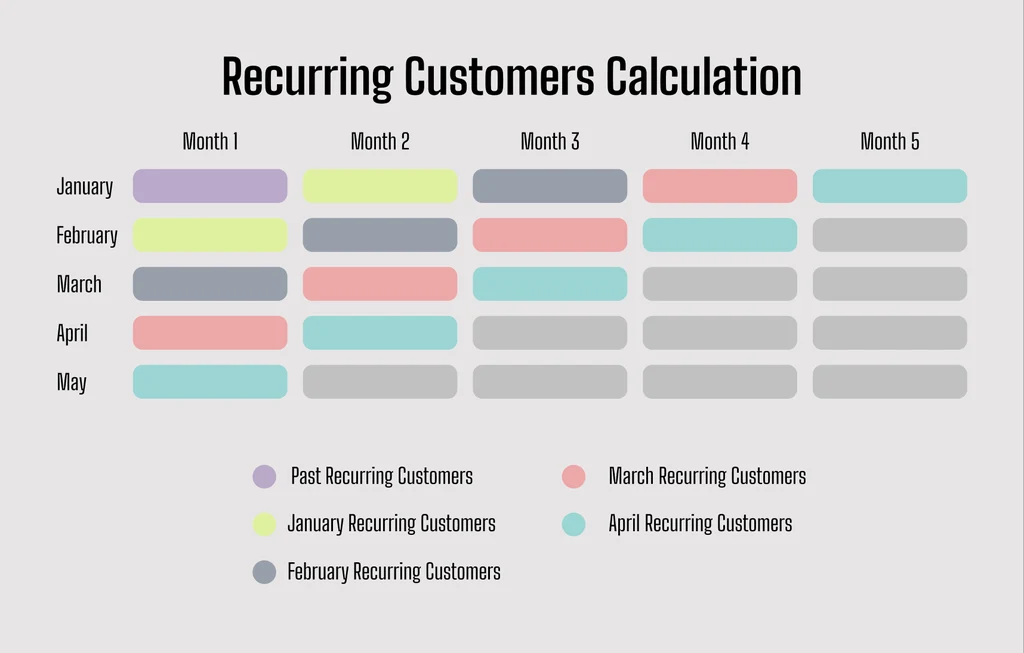
Month 0: The only recurring buyers will be the ones you’d already acquired in the past (let’s call them “Past Customers”). In other words, recurring customers will come from Month 1 of the Past Customers.
Month 1: The sum of:
- Month 2 of the “Past Customers”
- Month 1 of the customers acquired in Month 0
Month 2: The sum of:
- Month 3 of the “Past Customers”
- Month 2 of the Month 0 Cohort customers
- Month 1 of the Month 1 Cohort customers
And so on.
Here’s what’s important to understand:
The number of recurring customers will depend on how many customers you acquire in previous months. That’s why it’s important to forecast recurring and new customers at the same time.
The Outside: New Customers (Organic and Paid)
Even though we split them conceptually to explain why they matter, in practice making a precise distinction is almost impossible for one simple reason:
It’s very hard to know the true incrementality of your marketing efforts and separate which sales would have happened without ads (organic).
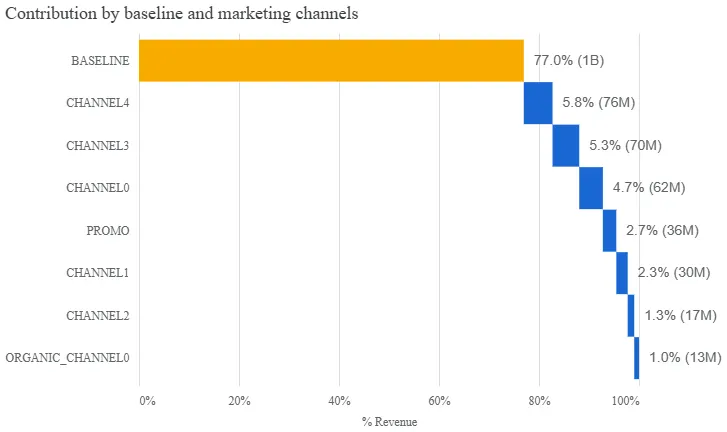
With incrementality tests and MMM we can get a reasonably accurate estimate, but knowing it for certain is impossible.
What we can do is make an approximation.
The Practical Solution:
The solution is simple to understand, but putting it into practice has some complexity.
Here’s how we do it:
- Analyze how many customers each channel has brought in historically
- Apply incrementality factors (if you don’t know what they are, I’ll leave you the link here)
Let’s walk through a practical example so it’s clearer.
Say we have an eCommerce that did €500,000 in revenue from new customers in October.
And we spent €100,000 on ads: €30K on Google and €70K on Meta.
Since we know platform revenue isn’t accurate, we need to apply the incrementality factor to understand which sales would have happened anyway.
When we download the report, we see the following:
| Channel | Spend | Platform Revenue | Incrementality Factor | Estimated Real Revenue |
|---|---|---|---|---|
| Google Ads Brand | €30,000 | €160,000 | 0.3 | €48,000 |
| Meta Ads | €70,000 | €250,000 | 1.2 | €300,000 |
So, when we apply the Incrementality Factor to the results reported by the platform, we see that:
- Real paid new customers = €48,000 (what Google actually generated) + €300,000 (what Meta actually generated) = €348,000
- Organic new customers = €152,000, which is basically the difference between total new customer sales and what our ads actually generated
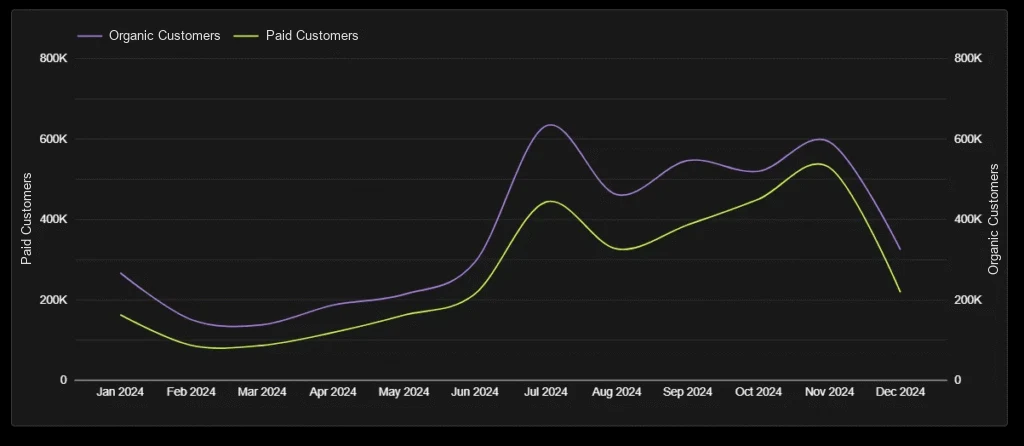
Again, this is an approximation, but it’s without a doubt far more accurate than blindly trusting what the ad platforms tell us.
With this data, we can now forecast:
- New customers who’ll come from ads: Depending on how much we spend.
- Organic customers: There should be a baseline that doesn’t change and another part that does vary depending on ad spend (more people buying, more word of mouth).
Understanding the relationship between ads and revenue is more complex and beyond the scope of this post, so we’ll skip it.
Important Considerations When Forecasting New Customers:
Forecasting new customers is the hardest part of the exercise. Here are some things you should keep in mind:
- Performance is based on historical data and assumes everything stays the same. If you improve your creatives, increase your conversion rate, or make your ads more incremental, your ROAS will probably go up.
- Efficiency drops as spend increases. You can’t assume your ROAS will stay the same if you double your ad spend.
- Validate your incrementality factors with real tests. If you haven’t had the chance to run incrementality tests, you can rely on benchmarks. And if you can’t find any, reach out and we’ll share ours.
- Factor in seasonality. Depending on your industry, some months will have more acquisition capacity. For example, if you sell kids’ clothing, September will be strong because of back-to-school.
And with this information, you can now build a forecast based on real, historical data.
Conclusion: The Forecast as an Exercise in Execution
As I said at the start, the forecast isn’t a guessing game where the marketing and finance teams get together to speculate about the future.
The forecast can and should be an exercise in strategy and execution, where goals are set based on the past and on what you’re going to do differently to reach them.
That’s why it’s essential to understand the parts that make up your eCommerce, forecast each one, and build strategies that move the needle, both in retaining recurring customers and in acquiring new ones — organic and paid.
Luckily, you now have the weapons to do it.
Need help with your forecast?
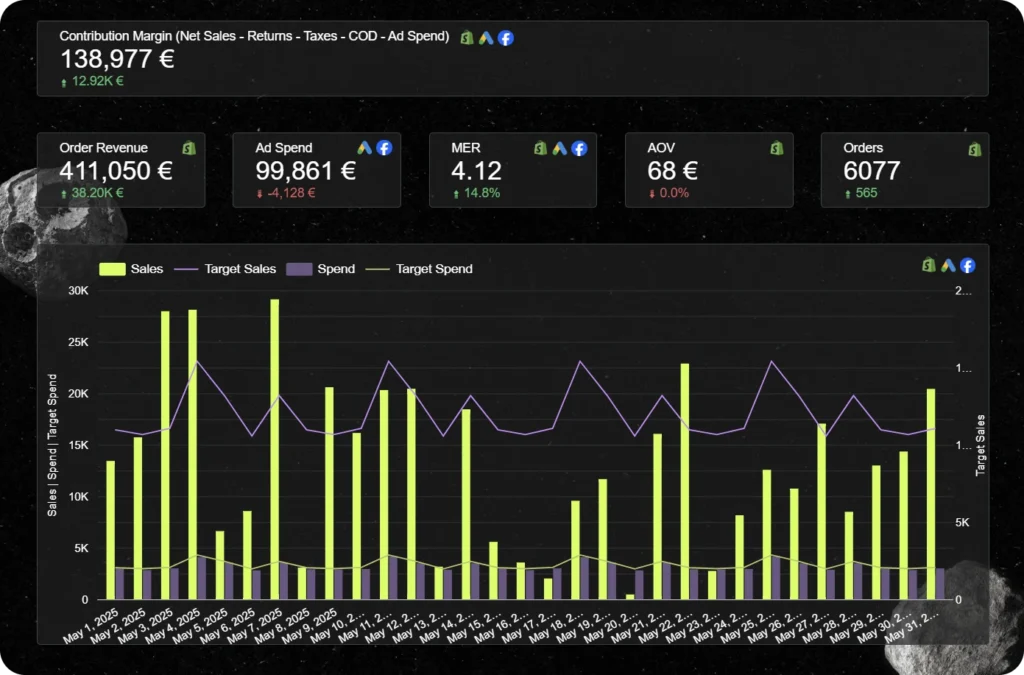
If you’re a 7-figure-plus eCommerce and need help building your forecast, from the P&L down to channel-level targets for the next 12 months, we can help.
It’s probably one of the highest-impact actions in the organization, since it determines:
- How many people to hire
- How much inventory to buy
- What the company’s profit will be
That’s why it’s so important to do it, and to do it right.
After building forecasts for dozens of eCommerce brands, we know the most common mistakes people make.
So if you want to save time and money building forecasts that actually have an impact, let’s talk.