
AOV Is Lying to You: Why 87% of AOV Strategies Fail
 By Juan Cruz Giusto ·

87% of the eCommerce brands I know are optimizing their AOV for ghosts.
I’m not kidding.
They take the AOV from their dashboard, build their entire AOV strategy around that number… and in the end the metric doesn’t budge.
Because that “average customer” who spends €67 per order doesn’t exist.
If you’re doing €1-30M in revenue and you’ve based decisions on AOV, this is going to hurt.
But it’s also going to help you build strategies that unlock thousands of euros.
The Hidden Problem With AOV
Let’s start from first principles.
AOV (Average Order Value) is what the average customer spends per order:
AOV = Total Revenue / Number of Orders
The formula looks basic and makes perfect sense, right?
That’s the problem.
The average says a lot… but it actually tells you nothing useful for making decisions.
A Real Case That’s Going to Hit Home
Imagine you run an eCommerce and you need to increase AOV to hit your targets.
You open Shopify. The chart shows a current AOV of €60.
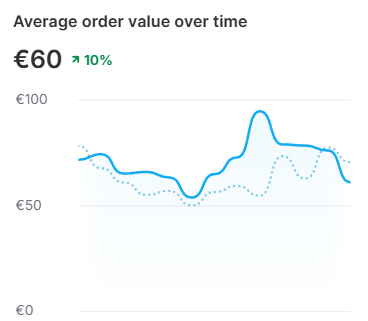
Based on that number, you roll out some strategic changes:
- Free shipping threshold at €65
- €10 cart upsells to help people reach the threshold
- Ads promoting €65 bundles
You wait a month. You check the AOV chart.
Surprise: It hasn’t moved.
Then the phone rings. It’s your CFO.
“We’re 20% down on Marginal Contribution since your changes. What the hell did you do?”
The Tyranny of the Average
The problem: you fell into the average trap.
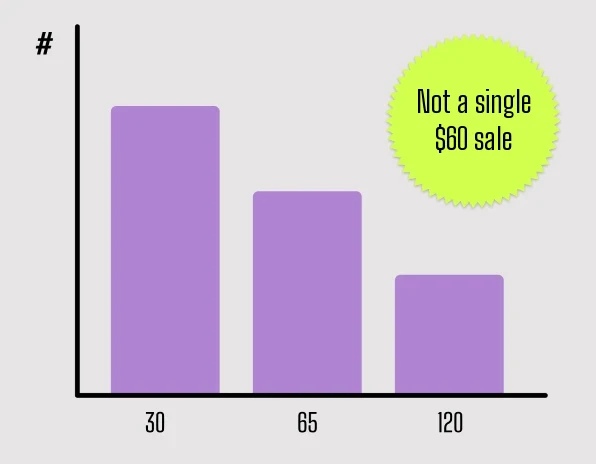
When you download the 1,000 actual orders, you discover:
- 450 orders of €30
- 350 orders of €65
- 200 orders of €120
There wasn’t a single €60 order!
You were optimizing for someone who never existed.
Meanwhile, you gave free shipping to 350 people who were going to buy the €65 product anyway.
And there’s your drop in Marginal Contribution.
Why Averages Are Dangerous
Averages have three critical flaws that hit your P&L directly:
1. Highly sensitive to outliers If a few high-ticket wholesale orders slip into your store, they artificially inflate your AOV.
Adding 10 sales of €1,000 each pushes the average from €65 to €70, creating a dangerous illusion.
2. Zero information about the real distribution Two eCommerce brands can have an identical €56 AOV:
- eCommerce A: Sells just one product at €56
- eCommerce B: 50% spend €6, the other 50% spend €106
Same AOV, completely different pictures, completely different strategies.
3. Destructive oversimplification Your business is complex. You have segments that prefer specific products, others that hunt for bundle discounts, and dozens of other behaviors.
Reducing all that complexity to a single number is a huge mistake.
As Todd Rose puts it in “The End of Average”: “Any system designed around the average is doomed to fail.”
Translated to eCommerce: any strategy designed around AOV alone is doomed to fail.
Beyond AOV: The Smart CMO’s 3 Tools
To build strategies that actually move your bottom line, you need three analytical tools:
1. Mean, Mode, and Median: The Revealing Trio
- Mean: The average you already know
- Mode: The most frequent value (in our example: €30, with 450 orders)
- Median: The value that splits your dataset in half (€65 in our case)
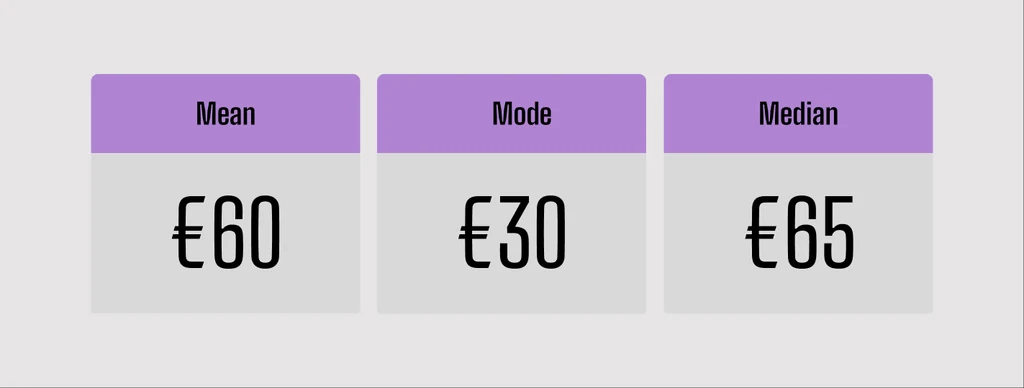
When the mean is lower than the median, you know you have a distribution with a long tail to the left. This information completely changes your strategy.
2. Histogram Analysis: My Personal Favorite
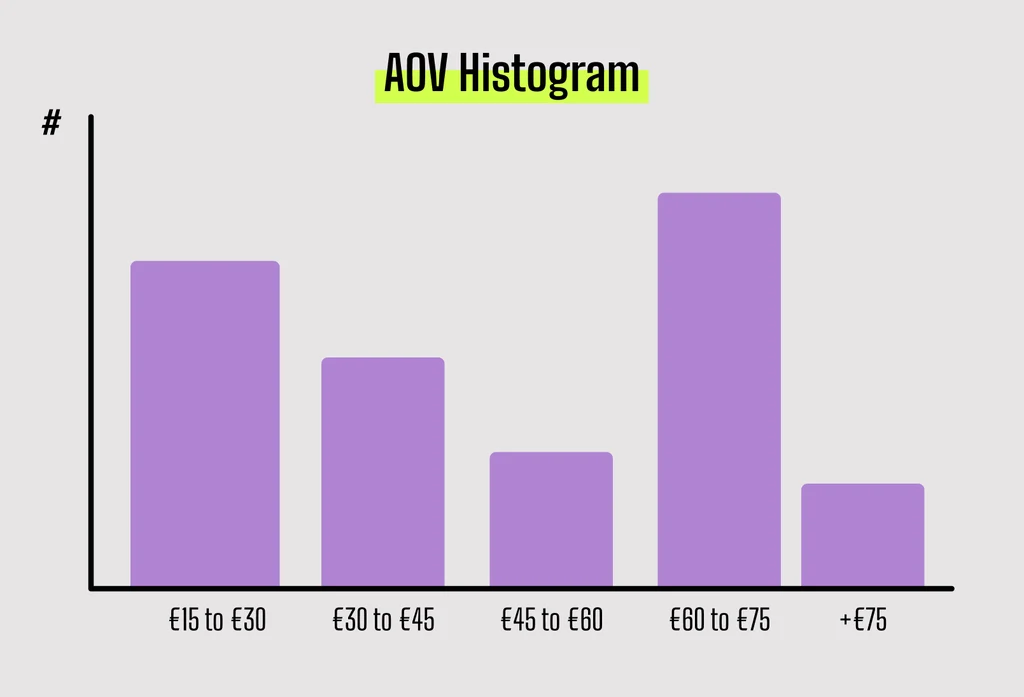
This chart groups data into intervals and counts the values in each one.
If we’d done this from the start, we would have seen that the interval with the most orders is €30.
The strategic question shifts from “How do we raise the €65 average?” to “How do we turn €30 buyers into higher-value buyers?”
3. Segment Analysis: Where Profitability Is Born
Once you’ve identified the segments, dig deep:
- Demographics: Location, age, gender, life stage
- Behavior: Preferred products, acquisition channel, specific ad
- Financial value: 60- and 360-day LTV by segment
Some answers you can get from Shopify and GA4. Others require post-purchase surveys and connecting your data.
With this qualitative information, you build strategies that actually accelerate growth.
Examples of Strategies Based on Real Data:
- If the €30 orders come from Meta Ads with a €20 CPA: Shift budget toward campaigns with more profitable products and better ROAS.
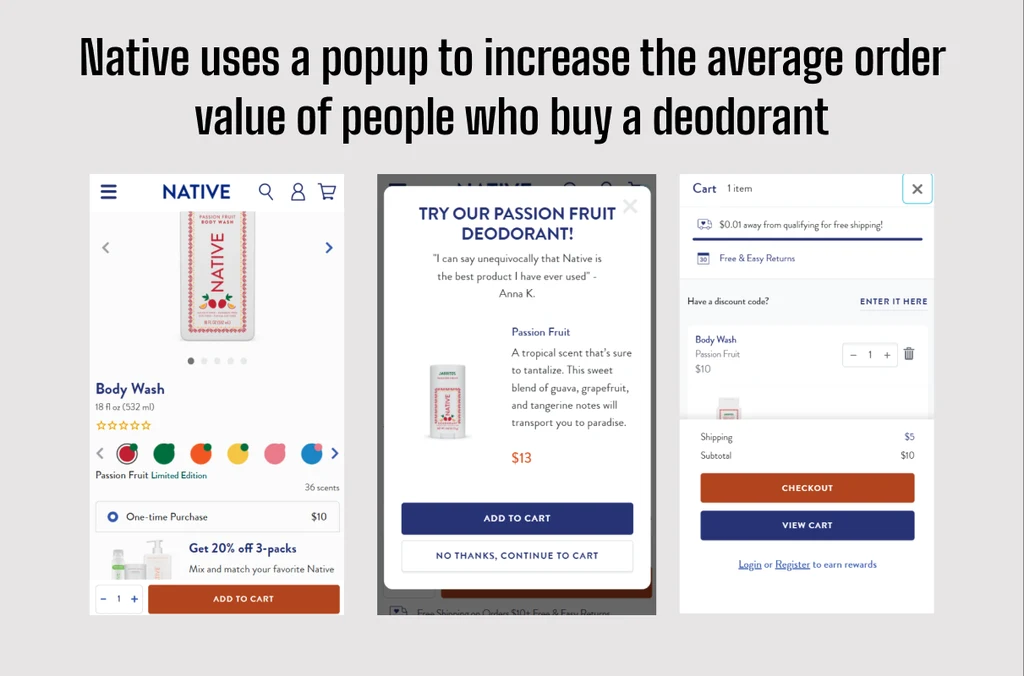
- For €30 product buyers: Build customer journeys with targeted upsell popups.
- Value incentive: Offer a free gift on orders over €35.
These strategies will be exponentially more effective than decisions based on AOV alone.
AOV Unlocker: The Tool You Need
So you don’t waste hours analyzing data in Excel, we built a GPT that does the heavy lifting for you.
Simple process:
- Download your eCommerce orders from the last few months
- If you use Shopify, use this code in reports:
FROM sales
  SHOW total_sales
  GROUP BY order_id WITH TOTALS
  SINCE startOfDay(-90d) UNTIL endOfDay(-1d)
  ORDER BY total_sales DESC
VISUALIZE total_sales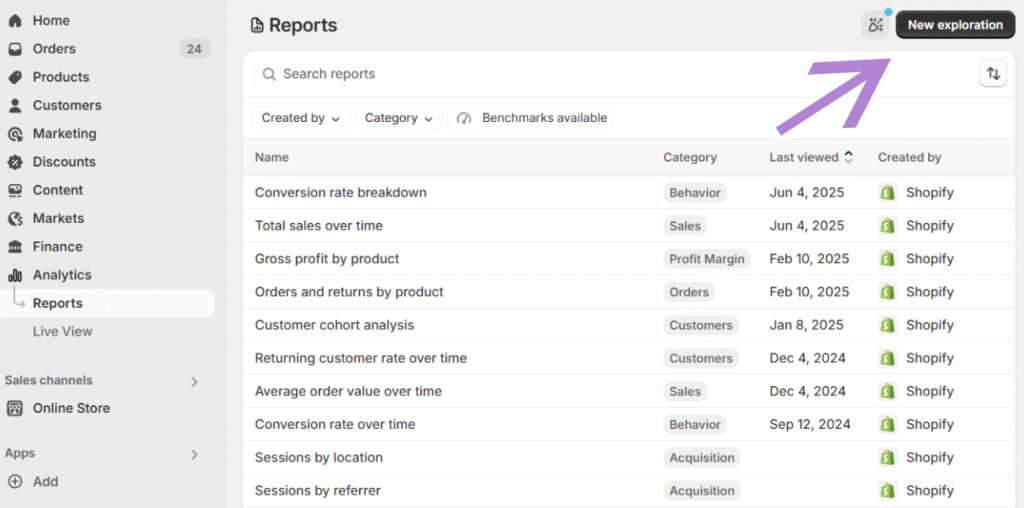
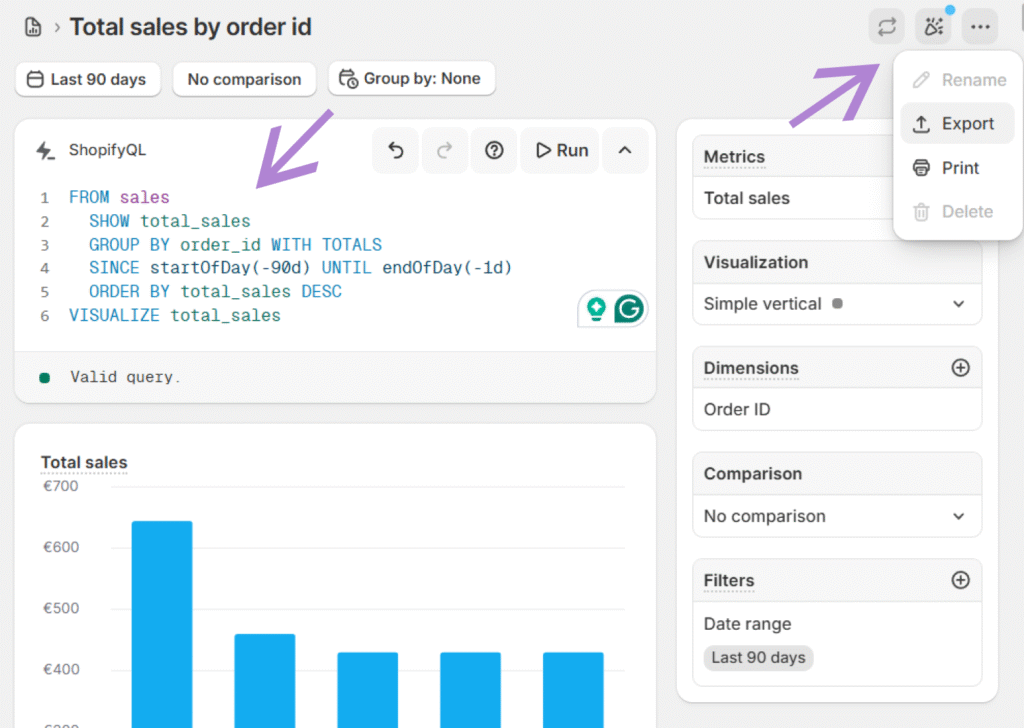
- Download the report as a CSV and upload it to AOV Unlocker
You instantly get:
✅ 100% reliable metrics: Mean, median, and mode validated with anti-hallucination safeguards
✅ Executive-ready charts: An 8-bin histogram with no noise or outliers, showing your biggest revenue opportunity
✅ High-margin recommendations: Upsells, bundles, and optimized thresholds to boost Marginal Contribution
✅ Copy-paste questions for Shopify: Get the missing data and refine your strategy like a 7-figure CMO
Want access to the GPT? Click below