
10 eCommerce Growth and Finance Metrics You Should Know
 By Juan Cruz Giusto ·

ROAS, gross revenue, traditional AOV… All of these metrics lie to you or give you an incomplete view of your business.
While your competition chases a 4x ROAS that’s probably inflated by 300%, you can use metrics that actually matter and help you make decisions with real impact.
If you want to grow profitably in 2025, you need to ditch vanity metrics and focus on the ones that reveal the financial truth of your business.
Here are the 10 that separate the brands that scale sustainably from the ones that end up burning cash:
1. Marginal Contribution
Net Revenue - Variable Costs - Advertising Cost
This should be the #1 metric on your dashboard, not buried in the P&L where nobody sees it.
Let’s break down its components:
- Net Revenue: Total Revenue - Returns - VAT
- Variable Costs: COGS + Shipping + Platform fees
- Advertising Cost: All ad spend attributed to generating sales
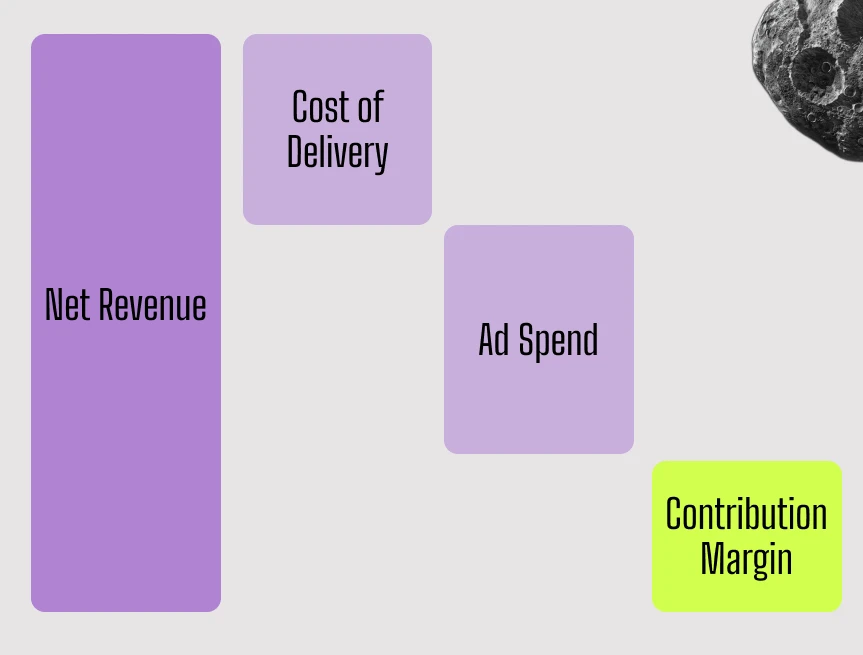
It’s what’s really left to cover fixed expenses, invest in growth, and pay out dividends.
Why it matters more than revenue: You can do €2M in revenue and have a negative Marginal Contribution, or one that doesn’t even cover your fixed costs.
I’ve seen cases where 40% of revenue goes to variable costs and another 35% to advertising. The result: losses disguised as growth.
2. Incrementality Factor
Real Results / Platform-Reported Results
Here’s something the ad platforms won’t tell you: they love inflating their results by taking credit for sales that would have happened anyway.
Example: In an incrementality test, we paused Madrid (€20K spend) and revenue dropped from €100K to €60K. Meta was reporting €50K, but the real impact was €40K.
In this case, the Incrementality Factor is 0.8 (80%).
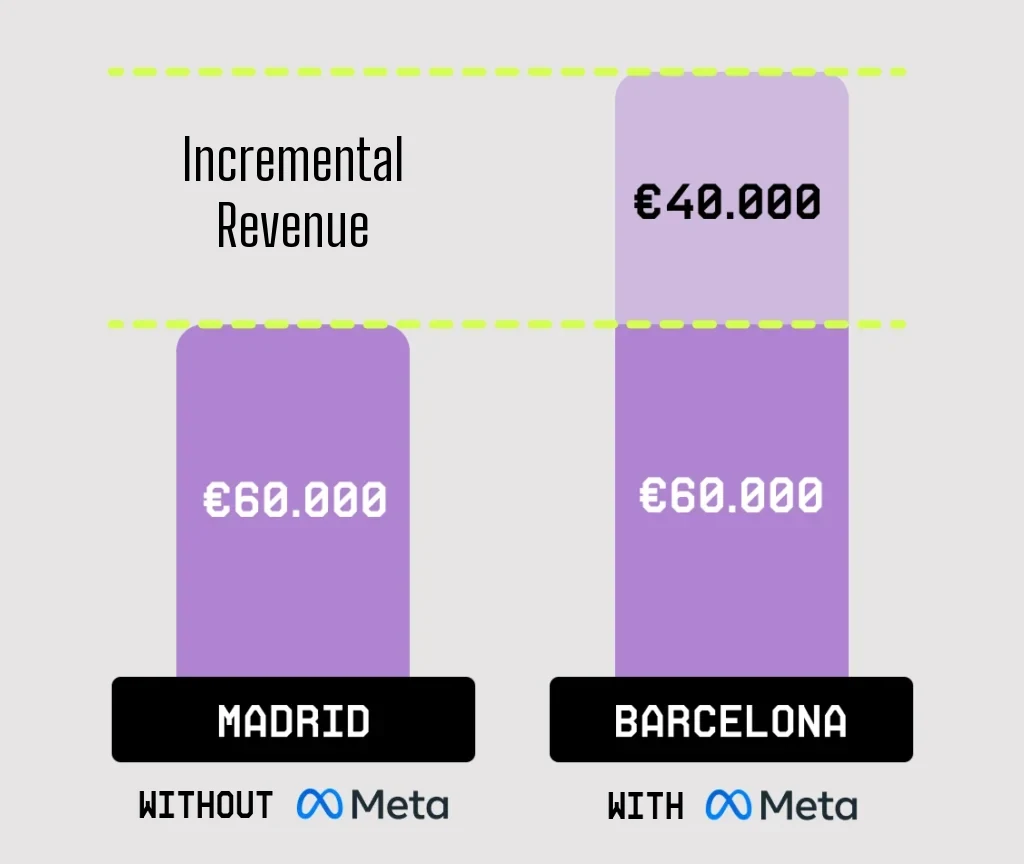
How to apply it: Multiply your platform ROAS by your incrementality factor to get your real ROAS, compensating for the platforms’ over- or under-attribution.
3. Payback Period
The number of days it takes to recover the acquisition cost through the revenue that customer generates.
Formula: Payback Period = nCAC / (AOV × Gross Margin × Monthly Purchase Frequency) × 30 days
Practical example:
- nCAC: €60
- AOV: €100
- Gross Margin: 40%
- Purchase Frequency: 0.8 times/month
Payback Period = 60 / (100 × 0.40 × 0.8) × 30 = 56 days
Why it’s critical: It tells you whether you have the cash flow to sustain your growth without outside financing. If your payback period is 6 months but your cash flow only holds up for 3, you have a serious problem.
4. Cash Conversion Cycle (CCC)
The time between when you pay for your inventory and when you get paid for selling it.
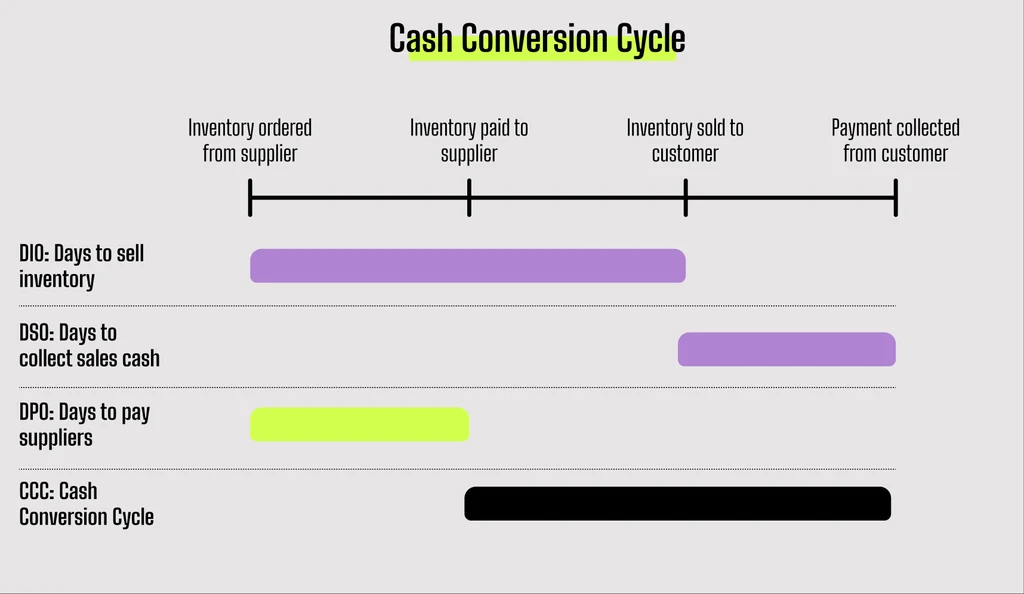
Formula: CCC = DIO + DSO - DPO
The 3 components:
- DIO: Days inventory sits in the warehouse = (Average Inventory / COGS) × 365
- DSO: Days it takes you to get paid = (Accounts Receivable / Sales) × 365
- DPO: Days it takes you to pay suppliers = (Accounts Payable / COGS) × 365
Example: DIO: 45 days + DSO: 2 days - DPO: 60 days = -13 days (a negative cycle!)
Why it’s pure gold: A negative CCC means you get paid before you pay, generating positive cash flow you can reinvest immediately.
5. Average Gross Margin per User
Conversion Rate * AOV * Average Gross Margin
The average gross margin generated by each user on our website.
Why it beats ARPU in eCommerce: ARPU tells you how much revenue you brought in, but it ignores variable costs. This metric combines conversion rate with real margin.
Example: Two eCommerce brands with a €65 AOV. The first converts at 2% with a 30% margin. The second converts at 2% with a 40% margin. Same revenue, completely different profitability thanks to higher margins.
6. Gross AOV / nCAC
This ratio measures the average gross margin of an order versus the cost of acquiring a new customer.
Important clarification: Don’t use AOV (gross revenue), use the first-order gross margin:
- Gross Margin = AOV - Variable Costs (COGS + Shipping + Fees)
- nCAC = Ad Spend / Orders Generated by Advertising from New Customers
Practical example:
- First-order AOV: €100, Variable costs: €55
- First-order gross margin: €45
- Ad spend: €10,000, New orders: 200
- nCAC: €50
Final ratio: €45 / €50 = 0.9
What it means: You’re losing €5 on every new customer’s first order. You need your 60-90 day LTV to make up for that loss, or this ratio needs to be above 1.
7. aMER (Marketing Efficiency Ratio)
New Customer Revenue / Ad Spend
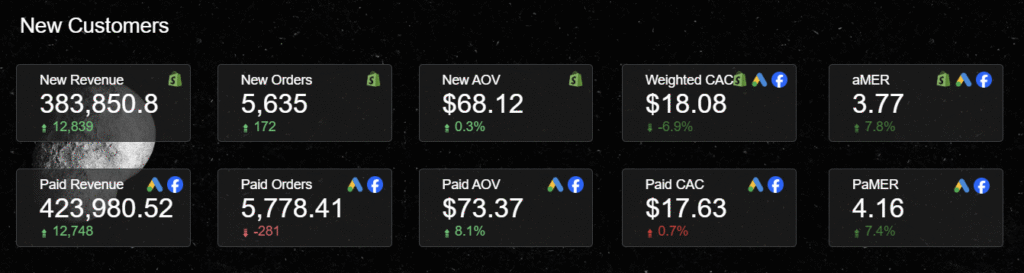
The critical difference vs. traditional MER: MER includes sales from returning customers, who you have cheaper ways to reactivate (email, SMS, social). aMER focuses only on new customers, revealing the true efficiency of your ad spend.
The reality that hurts: I’ve seen eCommerce brands with a 4x MER that actually have a 2x aMER. The difference is returning-customer sales being wrongly attributed to advertising.
8. 60-Day LTV Multiplier
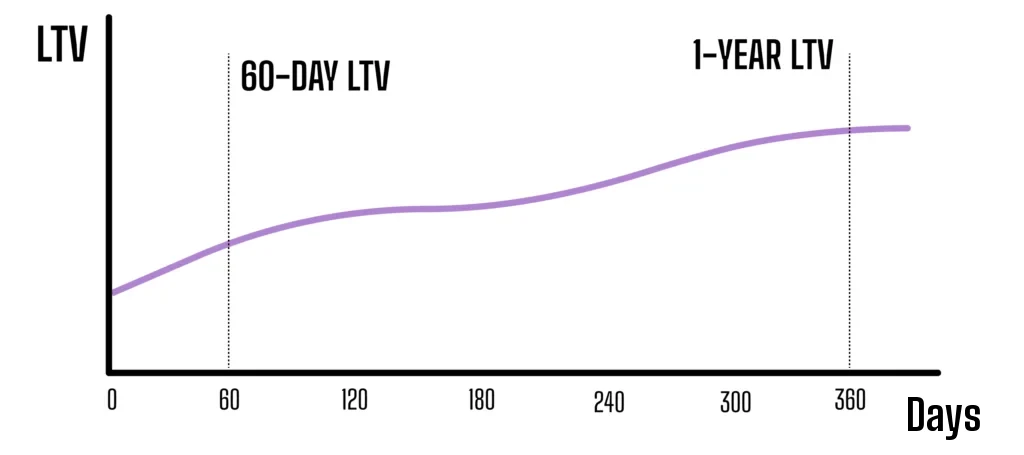
A metric that estimates the total value a customer will bring in during the first 60 days after acquisition.
Why 60 days: It’s the sweet spot between practicality and accuracy. Very few eCommerce brands can wait 12 months to evaluate LTV, but 30 days is too short.
Benchmark: A good 60-day LTV should land somewhere between 15-30% of total projected LTV, depending on the business.
Practical application: If your 60-day LTV is low, you have a huge growth lever in post-purchase flows, upsells, and early retention strategies.
9. 1-Year LTV Multiplier

The total value a customer will bring in during the first year after acquisition.
Benchmark: A good 360-day LTV should land somewhere between 75-100% of total projected LTV, unless you have a very high-margin product that makes up for the lack of LTV.
Key insight: If your 1-year LTV is low compared to benchmarks, you have a long-term retention problem you won’t see in short-term metrics.
10. Repeat Rate
What percentage of your revenue comes from returning customers versus new customers.
Watch out for the trap: A very high rate can signal an over-reliance on returning customers, hurting long-term growth.
Red flag: If more than 60% of your revenue comes from returning customers, you may be “emptying your piggy bank” and pulling forward sales that would have happened naturally.
Why These Metrics Beat Traditional ROAS
While your competition chases inflated metrics, you can use these to:
✅ Make decisions based on real profitability, not platform illusions
✅ Spot bottlenecks before they wreck your quarter
✅ Optimize for sustainable growth, not fireworks
✅ Protect your cash flow while you scale
✅ Detect a dangerous dependence on returning customers
The difference between growing at any cost (and going broke) and growing profitably comes down to the metrics you choose to optimize.
As Peter Drucker said: “What gets measured gets managed.” And when your team sees and chases these metrics every day, decisions automatically shift toward real profitability.
Need help implementing this metrics system in your eCommerce?
Book a FREE profitability audit and find out exactly how much money you’re leaving on the table with your current metrics.