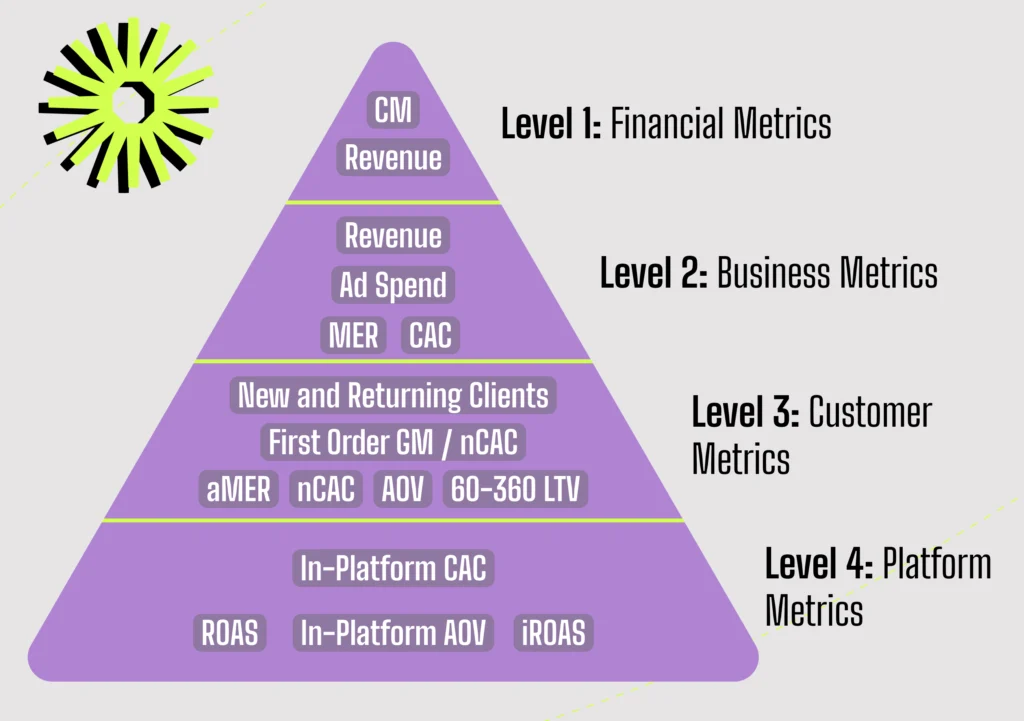

If your eCommerce isn’t growing profitably, the root cause lies in a single decision: you’re optimizing for the wrong metric.
Optimizing metrics disconnected from your profitability is the most direct recipe for failure.
But focusing on just one metric isn’t practical or actionable for a system as complex as an eCommerce business.
The difference between those who scale sustainably and those who stagnate lies in understanding the correct hierarchy of metrics and knowing the relationship between each one.
In this analysis, I’m going to present the complete metrics framework that 7 and 8-figure eCommerce businesses use to grow profitably.
It will allow you to identify exactly where the bottleneck is when your growth stagnates and what specific actions to take to solve it.

Financial metrics represent the purest reality of your eCommerce. They’re the closest to your bank account and the ultimate goal of any business: generating positive return on investment.

For eCommerce purposes, we define contribution margin as:
REVENUE – VARIABLE COSTS (COGS + SHIPPING + COMMISSIONS) – ADVERTISING INVESTMENT
While in traditional finance advertising investment might be classified as operating expense (OPEX), in eCommerce this is a mistake.
Why? Because this expense represents between 15% and 35% of revenue in 7 and 8-figure eCommerce businesses. To put this in perspective, HIMS – a telemedicine eCommerce in the USA – invests more than 40% of its revenue in marketing.
Since most of what’s invested is in Performance Marketing, this expense scales directly with revenue, behaving like a real variable cost.
The resulting contribution margin finances three critical pillars:
This should be your operational North Star Metric because your team has total control over it daily and it’s the metric closest to your financial reality.
Profit = Contribution Margin – Fixed Expenses
While it’s more complex to measure daily, it’s fundamental that leaders monitor it for medium and long-term strategic decisions.
CMOs have direct tools to impact this metric: streamline teams, leverage AI for automation, and eliminate unnecessary costs. Each optimization here translates directly into greater profitability.

These metrics reveal the general health of your operation and whether your strategy is working, without getting lost in tactical details.

Gross sales minus discounts granted. It’s what Shopify or WooCommerce report in a specific period.

Total invested in advertising with the direct objective of generating sales in the channel.
Critical consideration for multi-channel: If you also sell on Amazon, have a physical store, and invest in brand advertising, you must prorate costs according to the revenue level of each channel. Don’t allow your online store to assume 100% of advertising investment.
Revenue ÷ Advertising Investment
Indicates how many euros your eCom generates for each euro invested in advertising.
Critical warning: Don’t over-optimize this metric. If you only seek a high MER without considering absolute revenue, you can fall into the trap of under-investing in advertising, limiting your long-term growth in exchange for short-term efficiency.

These metrics protect the sustainability of your eCommerce and ensure you’re not optimizing the short term at the cost of the future.
The real danger: If you achieve revenue objectives by sending more emails than necessary to recurring customers, you’re emptying your piggy bank and bringing forward sales that would occur naturally.
The correct approach: Focus on acquiring new customers, who are the foundation of future revenue without losing sight of recurring customers (with new campaigns and product development).

Monitor both the absolute number and the relationship between both segments.
New Customer Revenue ÷ Advertising Investment
Since most of your advertising investment is destined to acquire new customers (you have more economical channels for recurring ones: email, SMS, social media), this metric reveals the true efficiency of your advertising investment.
Advertising Investment ÷ Number of New Customers
Tells you how much it costs to acquire a new customer, regardless of whether they arrive organically or paid.
Attention: It’s not First Order AOV. It’s the gross margin (sales minus all variable costs) of the first order.
If this ratio is below 1, you’re acquiring customers at a loss. Very few eCommerce businesses can afford this sustainably.
Keep this number above 1.
These metrics reveal the product mix you promote on web, social media, advertising and email/SMS.

Critical warning: These are the metrics furthest from your financial reality.
Unlike the previous ones (which you get from your business backend), platform metrics are indicative, not absolute. Facebook, Google, TikTok, and attribution platforms like Triple Whale or Northbeam depend on cookies to report results.
They’re not 100% reliable. They’re proxies for making decisions.
Platform-Attributed Revenue ÷ Advertising Spend on Platform

If you can conduct incrementality studies, apply that factor to platform ROAS to more faithfully reflect the reality of your efforts.
Advertising Spend on Platform ÷ Sales Attributed by Platform
Remember: These metrics are directional, not absolute truths.
The control paradox: The lower in the pyramid, the greater control and capacity for action you have.
It’s difficult to directly influence contribution margin, but it’s simple to improve Meta’s ROAS with new creatives or restructuring campaigns.
The precision paradox: The higher up in the pyramid, the closer you are to financial reality.
Reliability decreases as you go down levels. That’s why you need to consider all simultaneously to avoid biased decisions that optimize one level at the cost of another.

Understanding this metrics ecosystem is the first step to scaling profitably and predictably.
But it’s only the first.
What really makes the difference is creating:
This allows you to identify exactly which metric is failing and what specific action to take.
If revenue is low due to new customers, you’ll act differently than if the problem is with recurring customers.
Do you need help building this metrics and daily forecasting system for your eCommerce? We’re here to support you in creating a profitable and predictable growth framework.